ESG & Financial Performance Dashboard (Excel)
ESG and financial performance analysis in Excel using Power Query for data prep, Power Pivot (Data Model) + DAX for modeling, and an interactive dashboard for insights across industries, regions, and years.
Note: To explore slicers and interact with the dashboard, open ESG_Financial_Performance_Dashboard.xlsx.
Dashboard: ESG vs Financial Performance
Insights
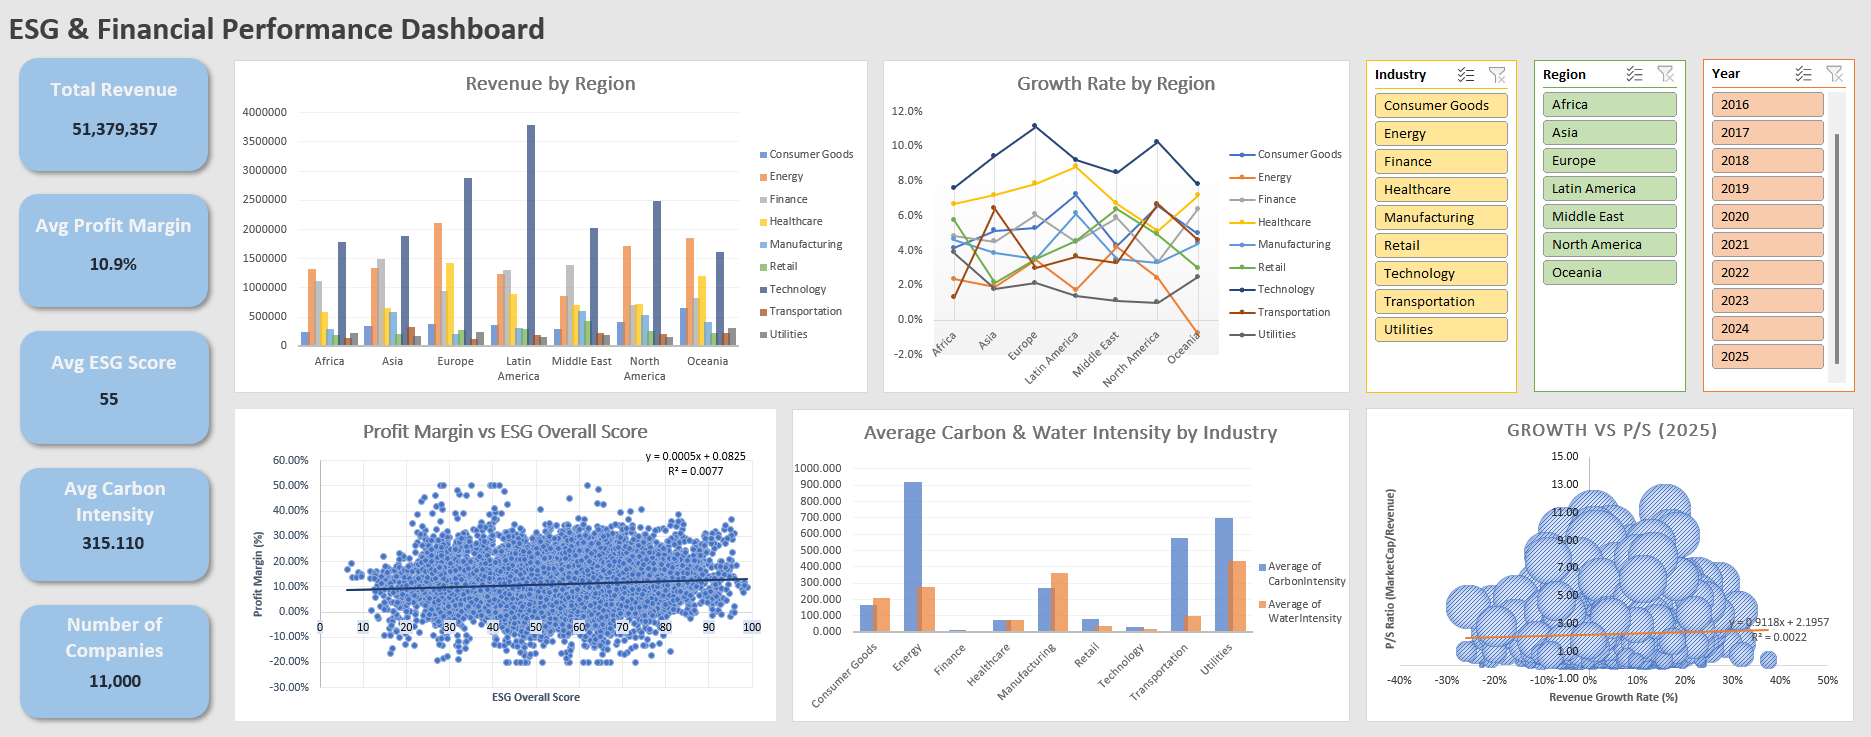
- The dashboard summarizes a large sample (11,000 companies) with Total Revenue of 51,379,357, an average Profit Margin of 10.9%, and an average ESG Score of 55.
- Revenue varies significantly by region and industry, with Technology appearing as the top revenue contributor across regions in the view shown.
- Profit Margin and ESG Score show an extremely weak relationship (trendline R² ≈ 0.0077), meaning ESG score alone does not explain profitability in this dataset.
- Environmental impact is strongly industry-dependent: Energy and Utilities stand out for high carbon intensity, while Utilities and Manufacturing show comparatively high water intensity.
- In 2025, Revenue Growth and Price-to-Sales multiples show almost no relationship (trendline R² ≈ 0.0022), suggesting valuations are influenced by factors beyond growth.
- Slicers (Industry, Region, Year) make it easy to drill into specific segments and compare how trends shift over time (2016–2025 shown).